The 3/10 Oscillator was developed by floor trader turned Market Wizard Linda Bradford Raschke.
This indicator has been created from the description given by the trader Linda Bradford-Raschke of an oscillator that she uses to assist in many of her trading decisions. Raschke is famous not only for having being one of just a handful of women who traded on the floor of the Chicago Mercantile Exchange, but also for successfully making the transition to screen trading. In 1992 she was featured in Jack Schwager’s bestselling ‘New Market Wizards’.
In an interview with Active Trader Magazine, Raschke described the indicator thus: “It’s the difference between a three-period simple moving average and a ten-period simple moving average. Plus, there’s a second line which is a 16 period simple moving average of the 3/10 line”.
The Delphic 3/10 Oscillator is programmed according to this description, but has been visually formatted for maximum ease of use. In the rest of this manual we explore various strategies and setups used by Raschke and her associates which incorporate the 3/10 Oscillator, as well as a few new applications for the indicator.
|
The Signal line (Grey) – a 16 period simple moving average of the 3/10 Oscillator line. The Zero line (Grey Axis) – corresponds to the crossover of the 3 and 10 period averages used to calculate the 3/10 Oscillator line. When the 3SMA crosses above the 10SMA then the Oscillator line will cross above the Zero line. The Histogram (Green/Red) – the normalised differential between the 3/10 Oscillator line and the Signal line. |
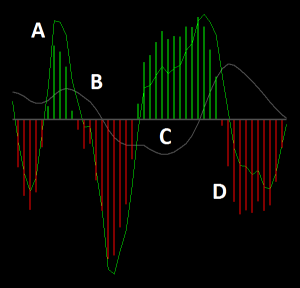 The 3/10 Oscillator line (Green) – the difference between a 3 and a 10 period simple moving average.
“ It’s something I’ve been using since 1981 . . . ” Linda Bradford-Raschke
“ Ultimately, most indicators show similar patterns, but I prefer the 3/10 Oscillator because I’ve become accustomed to its nuances and feel that it can be used as a ‘three-in-one’ oscillator: momentum indicator, swing indicator, and trend indicator. ” Corey Rosenbloom, CMT (afraidtotrade.com)
“ Any market that shows accelerating price gains (starting to go parabolic), is best traded using a momentum style ” Christopher Terry (LBR Capital)
The LBR ‘Grail’ Setup
This strategy is designed to take advantage of minor corrections in markets that have demonstrated accelerating momentum and strong directional movement. As well as the Delphic 3/10 Oscillator, it incorporates a 14-period ADX indicator (provided as standard in the TradeStation charting package), and a 20-period exponential moving average. The reverse of these rules (although with an ADX reading still above +30) applies equally well for short trades.
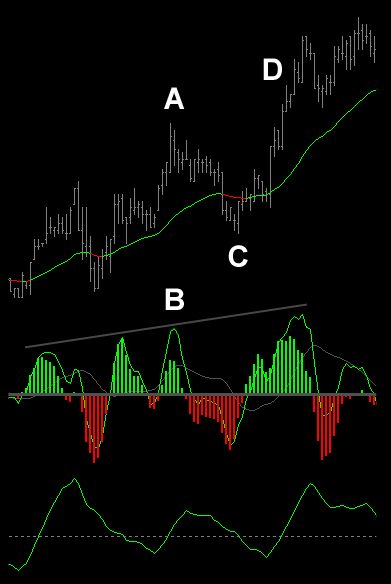 |
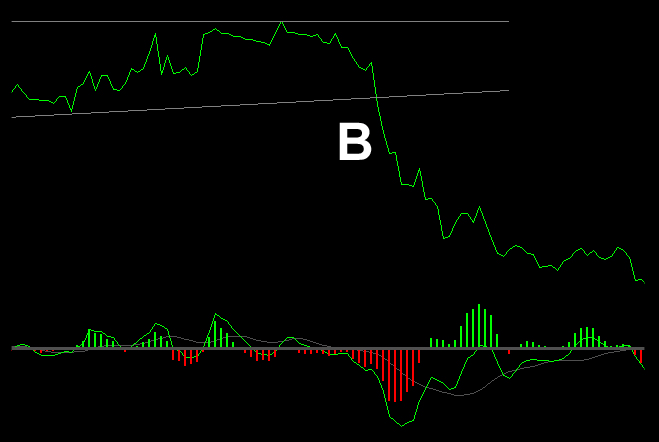
Rules for Long EntriesA At point A, a strong uptrend in the Nasdaq index future is forming, and the 14-period ADX has crossed above the +30 level. B The Delphic 3/10 Oscillator signals new momentum highs at point B, as the market continues to push higher. C As price pulls back to the 20-period Exponential Moving Average, a buying opportunity develops, and a long position is established. One easy way to do this is to enter a ‘Buy Limit’ order at the level of the Moving Average. D At point D the market re-tests its prior highs, and the trade can be exited for a profit. You may also wish to experiment with other exit criteria. It would be unwise to try and hold on to a position, however, if there were divergences between the 3/10 Oscillator and price at a retest of the highs. An important part of the appeal of this type of setup is that it is effective in many timeframes. |
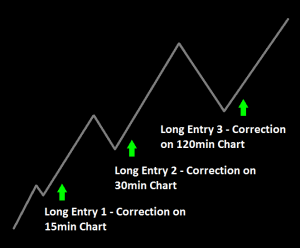
| Where a market continues to demonstrate sustained momentum to the upside, Raschke talks about moving from the timeframe where the first signal is generated (such as a 15 minute chart), and looking for the setup to repeat itself in successively higher timeframes.
These could be treated either as separate trades, with their own entry and exit criteria, or as a means of pyramiding into a longer term swing trade. See the diagram on the right. |
|
Buying New Momentum Highs with the 3/10 Oscillator
In fast moving markets such as the momentum environments that follow breakouts, often the first correction will not occur before the market has already moved significantly in the direction of a breakout, meaning that a strategy such as the ‘Grail’ setup described above cannot be implemented straight away.
Volatility and Channel breakout strategies can be effective here, but these often require substantial capitalisation against false signals. The following application for the 3/10 Oscillator was suggested by Raschke in an article at TradersLog.com.
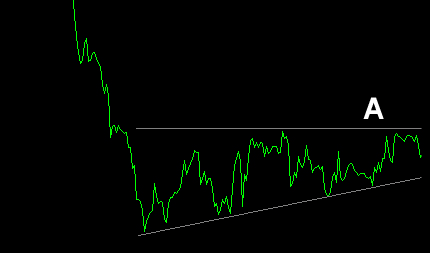
A On a higher timeframe chart, look for a contraction of volatility within a classical chart consolidation pattern such as a triangle or flag. This can be seen at point A on the daily chart of the EUR/USD above.
B Once a breakout formation has been identified, move to a lower timeframe chart such as the 30 minute one below right. A position can be entered (in the direction of the potential breakout on the longer timeframe chart) when both price and momentum make higher highs / lower lows. This occurs at point B below.
C Be prepared to be stopped out within the timeframe you are trading. Remember, you are assuming a relatively small amount of risk in this lower timeframe rather than a higher risk in a higher timeframe. Yet your profit target remains the same. So be prepared to make several attempts at entry to net a gain that is many multiples of your initial risk.
D Raschke recommends placing a stop-loss at the price that coincided with the last swing high/low of the 3-10 Oscillator. Alternatively, a volatility-based or optimised stop and profit target could be used. The Delphic Intelligent Stop could also be effectively deployed here. Most importantly though, be prepared to cut your losses short. While ever momentum is increasing, there will be many opportunities to take Delphic of new momentum highs.
The following quote from Raschke is taken from the article in which this approach is given:
“Trading is a matter of style and everything we do is a matter of trade-offs. A trader sacrifices initial trade location in exchange for higher confidence that the trade is working. A trader who tries to buy at the lower end of a trading range may have superior trade location. However, the odds of capturing an immediate quick gain might be a lot less than the trader who buys at a higher price but has the added benefit of the market momentum in his favour.”
Pro-Trader TipsPRO TIP: When using a momentum retracement strategy such as the ‘Grail’ setup, futures trader Tom Bierovic applies a Fibonacci filter criteria, entering “only when the countertrend decline is at least a 38.2 percent retracement but not more than a 61.8 percent retracement of the previous trend wave”. PRO TIP: Be careful when buying new momentum highs in the currencies. Even the most liquid of the forex markets have a tendency to produce price ‘spikes’ – sudden, strong directional movements that often have no follow-through trend. It is often much better to trade a currency future contract than the cash markets, as the spread is typically negligible. “In the long run it will be the management of the trade after the entry that counts more than the initial entry point” Linda Bradford-Raschke |
Testing the ‘Grail’ Setup
The ‘Grail’ setup can be a surprisingly effective way to trade the indices during the Globex hours outside the regular cash session. Unless there are significant news events, it’s fairly uncommon for major trend reversals to occur in the middle of the night, so once you’ve figured out the prevailing trend, you can use the setup to trade back into it.
As Globex volatility is low, you might want to relax the ADX requirements for entries – in the following studies we specified an ADX reading of +20. Programming the ‘Grail’ strategy, which is really a discretionary setup, is quite difficult. For our back-testing we made the following specifications for long entries (reversed for shorts):
- The time must be before 08:00 or after 16:00 exchange time
- The 14-period ADX must have been greater than +20 within the last 5 bars
- The Delphic 3/10 Oscillator must have been higher in the last 10 bars than at any other time in the last 30 bars
- A buy-limit order was placed at the 20-period exponential average
- A stop-loss and profit target of $400 was used
The TradeStation EasyLanguage Strategy code used in the back-testing has been given at the end of article.
No element of this strategy has been optimised apart from the ADX threshold (which does not use the most profitable optimised parameter). The back-test reports the results trading a single contract. $5 per roundtrip commission has been deducted. No slippage has been deducted as limit orders are used (there is no guarantee that limit orders would have been filled). No trend filter has been applied unless stated. Reporting excludes the regular cash session.
Signals from a Five Minute Chart of the E-Mini Nasdaq
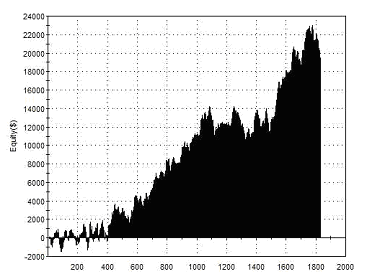 |
Total Net Profit Profit Factor Long Profit Factor Short Profit Factor Total Trades Percent Profitable Avg Trade Net Profit Maximum Drawdown |
$19,460 1.16 1.25 1.09 1,830 47.10% $10.63 $4,338 |
| Performance Report – LBR ‘Grail’ Setup – @NQ – 5min Bars – 04/01/2010-04/01/2011 | ||
Signals from a Five Minute Chart of the E-Mini S&P 500
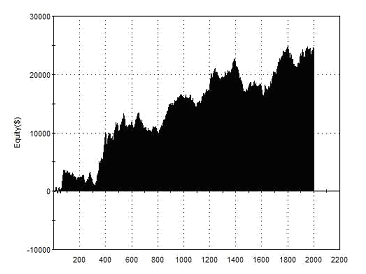 |
Total Net Profit Profit Factor Long Profit Factor Short Profit Factor Total Trades Percent Profitable Avg Trade Net Profit Maximum Drawdown |
$24,500 1.16 1.22 1.04 2,003 48.43% $12.23 $8,067 |
| Performance Report – LBR ‘Grail’ Setup – @ES – 5min Bars – 04/01/2010-04/01/2011 | ||
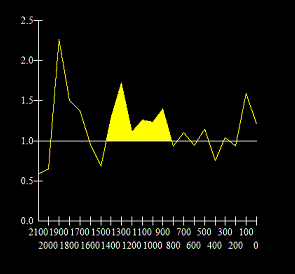
| In the Forex markets we can apply a similar entry time criteria to improve profitability. Most significant trends tend to be initiated as the markets assimilate new information around the London open (see the chart on the right showing profit factor by hour of entry).
A block of time in which profit factors were greater than 1.0 has been shaded yellow.
From this information it would appear that we can aim to participate in trends that develop from the London open by entering positions only within a five hour window, beginning at 09:00 (GMT) and ending at 14:00 (GMT). The end of this period coincides with the New York open, when trends from the London open are often reversed. |
Signals from a Five Minute Chart of the Japanese Yen Future
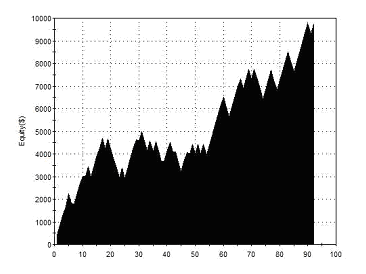 |
Total Net Profit Profit Factor Long Profit Factor Short Profit Factor Total Trades Percent Profitable Avg Trade Net Profit Maximum Drawdown |
$9,740 1.72 2.16 1.54 92 59.78% $105.87 $2,207 |
| Performance Report – LBR ‘Grail’ Setup – @JY – 5min Bars – 12/05/2009-12/05/2011 | ||
| // TradeStation EasyLanguage Strategy Code // LBR ‘Grail’ Setup for index future Globex session 5 min barsVariables: Tcond( false ), Osc( 0 );TCond = ( Time < 0800 or Time > 1600 ); Osc = Average( Close, 3 ) – Average( Close, 10 );If Tcond and Highest( ADX(14), 5 ) > 20 then begin If Highest( Osc, 10 ) = Highest( Osc, 30 ) and Low > XAverage( Close, 20 ) then If Lowest( Osc, 10 ) = Lowest( Osc, 30 ) and High < XAverage( Close, 20 ) then End; Setstoploss(400); |
References
Linda Bradford-Raschke articles referenced in this user manual:
- “Short Term Trading Strategies” – AIQ Opening Bell Monthly
- “Professional Traders Still Day Trade” – Stock Futures and Options Magazine
- “Trader Toolbox” – Active Trader Magazine
- “Linda Raschke Keeps Up the Pace” – Active Trader Magazine
- “Buying New Momentum Highs” – TradersLog.com
For information on chart patterns (‘Buying New Momentum Highs’) the traditional points of reference are John Murphy’s ‘Technical Analysis of the Financial Markets’ and Thomas Bulkowski’s ‘Encyclopaedia of Chart Patterns’. For a more hands-on guide to the practicalities of pattern breakout trading, we recommend Peter L Brandt’s excellent ‘Diary of a Professional Commodity Trader’.
 Platform Requirements: TradeStation 10.0 Platform Requirements: TradeStation 10.0Support Documents: Indicator GuideDeveloped by former floor trader Linda Bradford-Raschke, the 3/10 Oscillator provides an objective framework in which to refine your entries and exits. Download this indicator for free: |