Simple moving averages can be problematic. If they’re calculated over a longer period they become severely lagging and fail to reflect adequately recent changes in price; if they calculated over short periods to reduce lag, they become over-responsive to price change and generate numerous false signals.
In 2005 Alan Hull set out to resolve this problem, and using an elegant bit of mathematics he was able to develop a highly smoothed moving average that almost complete eliminates lag. The result was the Hull Moving Average – an indicator that is able to track price change yet also exhibit superior smoothness compared to simple moving average of the same length.
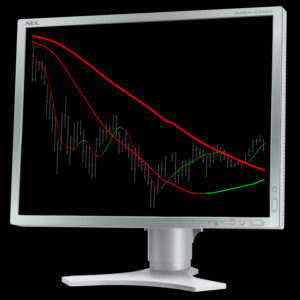
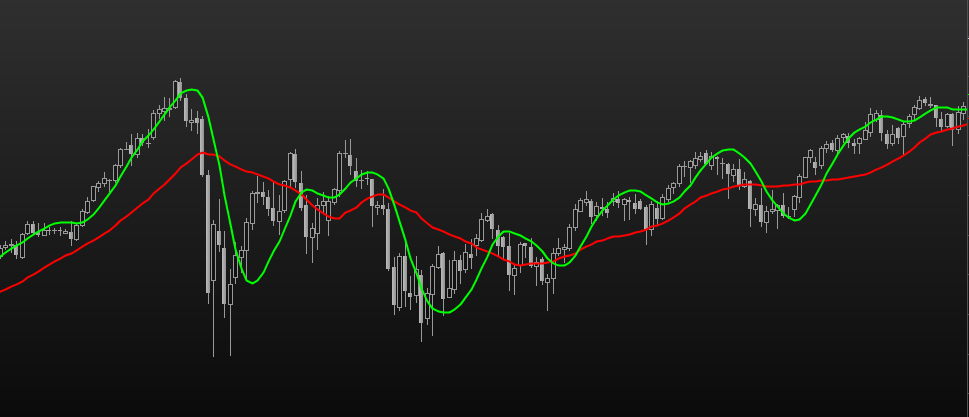
The chart below shows a 25-period Hull Moving Average (green line) compared to a 25-period Simple Moving Average (red line):
Alan provides an excellent explanation of the logic underlying his approach on his own website, breaking down the various steps involved in the calculation with chart examples to illustrate his rationale: alanhull.com.
We’ve coded the Hull Moving Average for TradeStation using Alan’s original formula with no modifications, as it does precisely what it has designed to do – offering all the smoothing benefits of a long term average combined with the reactivity that traders require to generate timely signals.
The rest of this strategy guide explores just some of the many ways you might choose to employ this innovative indicator in your decision making, ranging from discretionary approaches to systematic applications for large portfolios, enabling you to make the most of the Hull Moving Average, whatever your trading style.
Momentum Retracements
The following strategy is adapted from a momentum trading approach described by Tom Bierovic. Several Hull MAs are used for entries and filters, alongside a standard Tradestation indicator – the Directional Movement Index. The entry criteria given below are for buy signals – the rules are reversed for short entries. This strategy is not timeframe dependent, and is effective on daily and intraday charts.
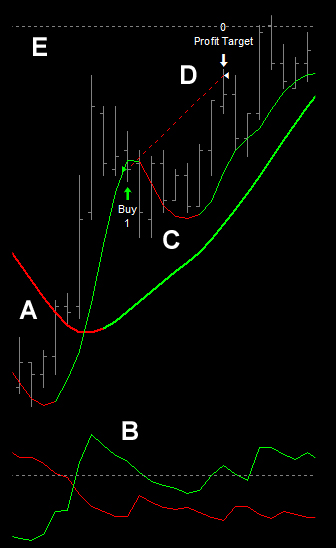
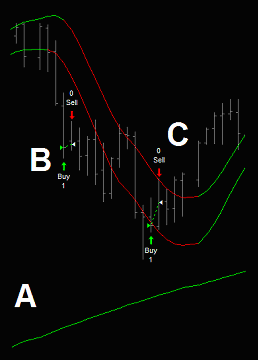
A. A 9-period Hull MA of the lows has been added to the chart, along with a 49-period Hull MA of the closing price. The Directional Movement Index (DMI) indicator, provided as standard in the TradeStation charting package, has also been added.
B. At point B we identify a market that is trending strongly enough to generate readings of the DMI+ (green) line above 25. You may also wish to employ your own methods of determining trend strength, or consider fundamental factors here.
C. The market pulls back at point C and closes below the Hull MA of the lows, but above the 49-period Hull MA. This generates a ‘Buy’ signal. It does not matter if the DMI+ line drops below 25 on this bar. However, do not buy a retracement below the 49-period filter average.
D. The trade is exited when the market re-tests the highs of the trend. You should find an appropriate exit strategy for the market you are trading. Both fixed dollar targets and adaptive stops/targets based on market volatility can work well. The Delphic Intelligent Stop could also be employed here.
It makes sense to apply your knowledge of the market you trade to adapt this strategy and make it your own. The E-Mini S&P futures contract, for example, exhibits a strong tendency to revert to its mean.
An effective filter here is to avoid signals that occur after the market has just made a new intraday high, as significant retracement is likely.
In the example above, the cash session high is shown by the line at point E – both the long entry and the profit target are below this high (in this instance the market did indeed subsequently stall at a re-test of this high).
Certain forex pairs and commodities, on the other hand, are capable of producing strong breakout trends, so the reverse of this rule may be effective; buy only when the market has made a new high within the trend.
Trend-Following Entries with the Delphic Hull MA
For those who want to day-trade without the intensity of high-frequency scalping, trend following type strategies that provide just one or two entry signals per day can be ideal.
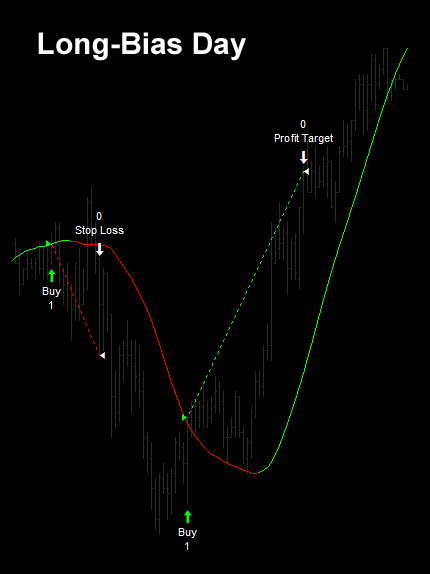
The entry signal presented below uses a crossover of the closing price and the Delphic Hull MA.
- On a five minute chart, add the Delphic Hull MA indicator with the length parameter set to 81. For more info on the advantages of using square number parameters for this indicator, see the ‘pro-tips’ below. This parameter has been chosen because it is a perfect square number (see ‘pro-tips’ below); it has not been optimised in any way.
- When price crosses and closes above the Delphic Hull MA, enter long (enter short on a negative crossing). Use this signal only to establish new positions from flat, but not to reverse a position already held.
- Set an appropriate stop-loss and profit target for the current volatility of the instrument you are trading. Below, examples of both a losing and a winning long trade are shown.
A critical element of the success of this type of strategy, where you are aiming to enter as a significant intra-day trend gathers momentum, is to know the times when such trend changes typically occur in the market you are trading.
It is worth noting, for example, that two-thirds of the profits in the example below were generated from entries solely in the thirty minutes prior to the cash session open. The remaining six and a half hour trading window was responsible for just one third of profits. Clearly reversals occurring shortly before the cash session open present a significant opportunity in this particular market.
Without having tested in detail, we would suggest that the period around the London open may represent similar opportunities for forex traders with this strategy, while single-stock traders might want to use this entry method around news breakouts.
Here are the results of trading this strategy with a single E-Mini S&P futures contract over a five year period. A further long-term trend filter was also introduced: long positions were only taken when the prior day closed above its two-period simple moving average. Though this slightly diminishes profits, it improves the average profit per trade and significantly reduces the total number of trades.
The stop-loss of $200 is the only element of this strategy to have been optimised. A profit target of $800 was used. $5 per roundtrip commission has been deducted. No slippage has been deducted. Reporting covers the period from 08:00 to 15:00 exchange (CME) time.
 |
Total Net Profit Profit Factor Long Profit Factor Short Profit Factor Total Trades Percent Profitable Avg Trade Net Profit Maximum Drawdown |
$42,663 1.27 1.30 1.24 7693 66.98% $10.05 $5367.50 |
| Performance Report – Intra-day Trend Following – @ES – 5min Bars – 01/23/2007-01/23/2012 | ||
Pro-Trader Tips
The formula used in this indicator makes use of a square root function. This means that perfect square numbers – 4, 9, 16, 25, 49, 81… – are an ideal choice of setting for the length parameter of the indicator. They have been used in the strategies throughout this document – an interesting study would be to see how closely these square numbers correspond with the optimal setting for each strategy.
It is not generally advisable to employ the Delphic Hull MA in ‘moving average crossover’ type strategies.
The inherent lag in standard moving averages is an inherent part of why these strategies work; because the Hull MA exhibits virtually no latency it is an unsuitable choice for such strategies and will cause whipsaws.
“Most trends are a series of longer term thrusts in the primary direction interrupted by short term corrections of lesser magnitude.”
Adam White, Technical Trader’s Bulletin
“A simple application for the HMA, given its superior smoothing, would be to employ the turning points as entry/exit signals. However it shouldn’t be used to generate crossover signals as this technique relies on lag.” Alan Hull
When using a momentum retracement strategy such as the one described above, Tom Bierovic discusses using a Fibonacci level filter to enter “only when the counter-trend decline is at least a 38.2 percent retracement but not more than a 61.8 percent retracement of the previous trend wave”.
Linda Bradford-Rasche, whose “Grail” trade is a similar momentum based setup, notes that she actively manages such trades, and
will “look to exit on a push to new highs”.
Forget About Price – Trade the Indicator!
If you make regular use of Fibonacci levels in your trading, but sometimes find it difficult to know where to start measuring from, the Hull MA indicator can be a great way to cut through noise and aberrations and identify key turning points in trends.
When performing Fibonacci analysis, try this unconventional approach: remove the price bars from your chart to leave just a 4-period Delphic Hull MA behind (setting the price bar colour to the same as the background is the easiest way to do this). Now perform your analysis treating the Hull MA as a proxy for price.
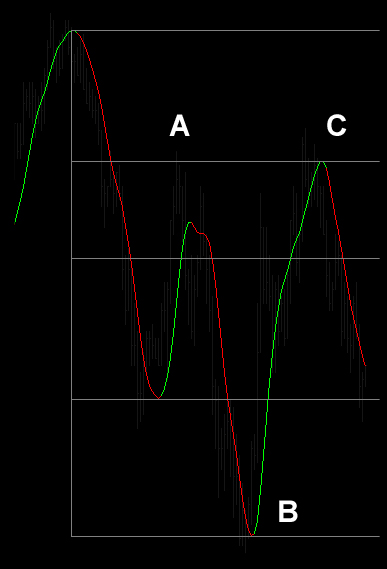
In the example on the above, the pre-market high and low of the Delphic Hull MA have been used as the basis for Fibonacci price extension lines that successfully predict the major turning points of the day’s cash session (at the points marked A, B, and D).
Please remember that this is just a technique to aid analysis; all the usual caveats and pitfalls of Fibonacci trading would still apply!
There are other ways to incorporate this “Price Poxy” approach into your trading. More-so than any standard moving average, the Delphic Hull MA is able to bring a smoothing function to data. If you find that your strategy tends to produce a lot of whipsaws and false signals, and you trade from the close of price bars (or indeed from the high, low, or open), then try using a Hull MA with a very short length setting, and treat that as the ‘closing’ data that you use in your trading decisions.
The ‘Outside Three’ Swing Strategy
The ‘Outside Three’ of this strategy’s name refers not to ‘outside day’ price bars, but to three consecutive closes outside of a price envelope formed using the Delphic Hull MA. Add to this a long term trend filter and a variation on a classic exit strategy, and you have a simple, robust, and highly profitable swing trading strategy that you can deploy across a wide range of markets.
Let’s start with the trend filter, as there’s nothing new here: long entries will only be taken when price is trading above a 200 period SMA of the closing price, and short entries when it is trading below. We also apply a 25 period Hull MA of the highs, and a 25 period Hull MA of the lows, to the daily price chart, forming an envelope or channel. This 25 period setting has been chosen because it is a perfect square number. The criteria for a long position are as follows:
 A. Price is trading above the 200 SMA and also above the 25 period Delphic Hull MA of the lows, as can be seen at point A.
B. The market then closes below the Delphic Hull MA of the lows for three consecutive days. The relationship of the closes to each other is not important. A buy entry is signalled on the close of this third consecutive day at point B.
C. A long position is exited, for either a loss or a profit, on the first higher closing day after entry. A higher close is simply one that closes at a greater price than the previous day, as shown at point C.
For short entries and exits the rules are reversed.
This exit technique has been adapted from a concept introduced by the commodities trader Larry Williams, some of whose strategies called for an exit on the first profitable open.
Now that the cash session open assumes less significance than it did at the time Williams was writing, our research has shown that an exit on the close produces stronger results. Also, we are using this strategy to exit both profitable and un-profitable trades, rather than just the former. You should note that no hard stop is being employed – we will suggest one shortly as we demonstrate several improvements to the system.
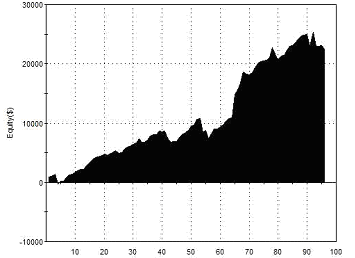
As described above then, this strategy produces the following results in the e-mini S&P futures:
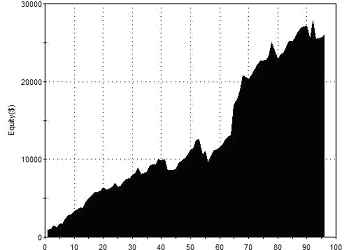 |
Total Net Profit Profit Factor Long Profit Factor Short Profit Factor Total Trades Percent Profitable Avg Trade Net Profit Maximum Drawdown |
$25,950 2.99 3.86 2.35 96 82.29% $270.31 $4,850 |
| Performance Report – Outside Three Swing Strategy – @ES – Daily Bars – 22/01/2002-22/01/2012 | ||
You have probably already noticed that this strategy doesn’t include any kind of fixed stop. To say that it doesn’t include any stop at all is not true; the method is to exit on the first up close (in the case of a long trade), and absolutely no market moves indefinitely without a counter-trend close.
Nevertheless, many traders will be uncomfortable trading with this dynamic and mentally-held stop loss. Rather than look for some sort of fixed dollar-per-contract stop, let’s see what happens if we introduce a stop at the long term filter average.
Any market crossing this average does, in terms of our strategy at least, throw into question the initial criteria upon which the trade was entered. If we only take short signals in a bear market that trades below its 200 period average, do we still really want to hold a short position in this market once it rallies above this MA?
The results of introducing this hard stop are as follows:
 |
Total Net Profit Profit Factor Long Profit Factor Short Profit Factor Total Trades Percent Profitable Avg Trade Net Profit Maximum Drawdown |
$22,500 2.40 3.35 1.77 96 81.25% $234.38 $4775 |
| Performance Report – Outside Three Swing Strategy – @ES – Daily Bars – 22/01/2002-22/01/2012 | ||
As you can see, this has a slight negative impact on the system’s performance, with both the profit factor and the total net profit falling. Because we’re aiming to limit our losses, the most significant measures here though are the maximum drawdown and the largest losing trade (not shown). The maximum drawdown is reduced by a paltry $75, and at $2,362 the largest losing trade remains completely unaffected.
If your psychological personality is such that you can’t sleep at night if you don’t have a stop-loss to limit your exposure, then this is one possible solution, but don’t expect it to do anything for your profits!
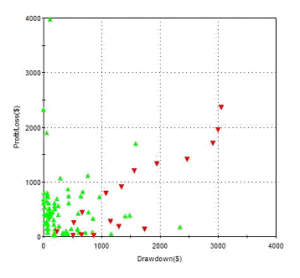 Another possibility would be a dollar stop derived from the Maximum Adverse Excursion (MAE) in back-tested results.
In the back-test above, no position that eventually realised a profit experienced a trade drawdown of more than $1600 – this can be seen on the chart on the right, in which losing trades are shown in red and profitable trades in green. So in this instance $1600 could provide an MAE Dollar Stop to reduce the exposure during losing trades.
Bear in mind that MAE stop-losses are entirely dependent upon the sample data being representative of future price behaviour.
We’ll now turn our attention to the exit method. One concern, when you examine signals generated by this strategy on a daily price chart, is that many positions are exited for just a small profit (on the first up or down closing day) at the start of mammoth trending moves.
Don’t we want to try and remain in the market to benefit from these, letting our profits run?
As a ‘swing trader’, the short answer is “no” – we want to take a quick profit, not establish long term positions, and a single strong day of price movement can exhaust a market in the short term. Nevertheless, let’s adapt our code to explore the effects of stipulating different exit requirements for positions that are showing a profit as opposed to those that are showing a loss:
- Long positions are exited on the first higher close if that close is below the entry price (the reverse applies for short trades).
- Long positions are exited on the second successive higher close if that close is above the entry price (the reverse applies for short trades).
Another issue with the original (and indeed the modified) exit rule is that it takes no account of how much higher or lower the close is. If a long position is entered, it will be liquidated for as little as a one tick profit, if the close is just one tick higher on the day after entry.
This doesn’t seem very satisfactory and there are many ways around it, the simplest being to stipulate a minimum dollar profit that must be attained before a position is exited.
A more sophisticated and dynamic approach, factoring in market volatility, would be to stipulate a profit target derived from a statistical measure such as Standard Deviation. Exiting long positions on the first higher close if that close is greater than one (five period) standard deviation (of the closing price) from the entry price, produces the following results (with the opposite rule applied for short positions):
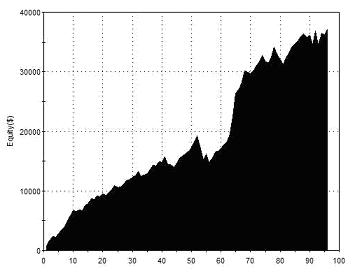 |
Total Net Profit Profit Factor Long Profit Factor Short Profit Factor Total Trades Percent Profitable Avg Trade Net Profit Maximum Drawdown |
$37,062.50 2.94 3.19 2.76 96 71.88% $386.07 $5,975 |
| Performance Report – Outside Three Swing Strategy – @ES – Daily Bars – 22/01/2002-22/01/2012 | ||
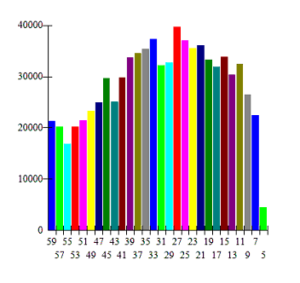 Finally, we’ll take a quick look at the effects of optimising the length setting for the Delphic Hull MA. This is not because we would necessarily wish to use the most optimal length setting, but because we want to check that the strategy is robust, and that it remains profitable across a broad range of values for the length parameter.
The chart on the left shows the performance (profit factor) for various length settings. You can see that the random value of 25 which we chose (because it is a square number) proves to be very close to the optimum for this data set. However, it is surrounded by a large area of similarly profitable values, and all the values tested produced positive returns.
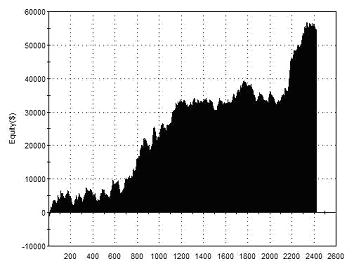
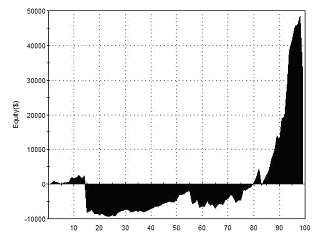
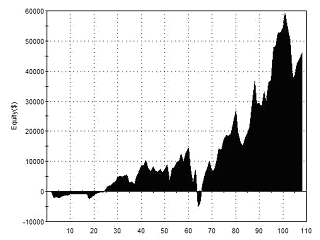
The following equity curves show the performance of the ‘Outside Three’ Strategy across a variety of markets. The entry and exit criteria tested include the profitable/unprofitable exit rule described above, but do not include any of the other changes discussed. No element of this strategy has been optimised or curve-fitted – the tests use a 25 period Delphic Hull MA. All tests cover a ten year period and trade a single contract for futures, and 10,000 shares of individual stocks and ETFs. No commission has been deducted. No slippage has been deducted. Entry-on-close is assumed.
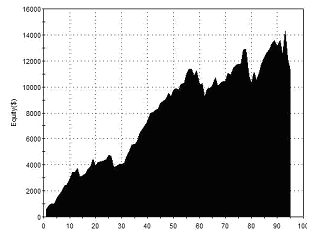 |
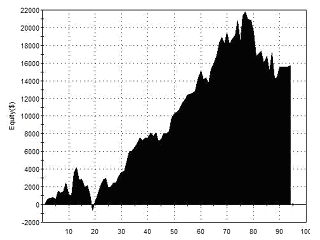 |
| @NQ – Nasdaq Futures | @JY – Japanese Yen Futures |
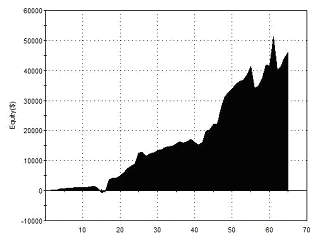 |
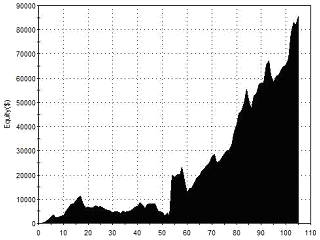 |
| BIDU – Baidu Inc. | AMZN – Amazon.com |
 |
 |
| NFLX – Netflix Inc. | AAPL – Apple Inc. |
Hull MA
|