The Delphic Intelligent Stop is a ‘canned’ risk management tool that has the potential to be incorporated into any strategy. Using a unique proprietary method for measuring volatility, stop-losses for both long and short positions are plotted above and below current prices.
By factoring in current market volatility, the Intelligent Stop is designed to ensure that your stop-loss is placed beyond the reach of current market noise, and will only be hit if the market moves significantly against you, giving a clear signal that it’s time to protect your capital.
Here are some more features of this versatile indicator:
- Trailing stop-losses – the Delphic Intelligent Stop trails favourable price action, enabling you to lock in profits as a position moves in your favour. The stop-loss only ever moves in the direction of the trade, so even if volatility increases or prices begin to reverse, it will never increase your risk.
- Stops for both long and short positions can be switched on and off, helping to keep your charts un-cluttered and allowing you to focus on opportunities based around your current market bias.
- As well as stop-losses, the indicator can also be set to plot profit targets based on the same volatility adjusted criteria. By inputting the entry price for your trade, a profit target can be plotted at a fixed ratio from the stop, so that you can maintain a positive risk/reward ratio tailored your own particular trading style.
- Once a stop loss has been hit, the indicator recognises this and will reset itself.
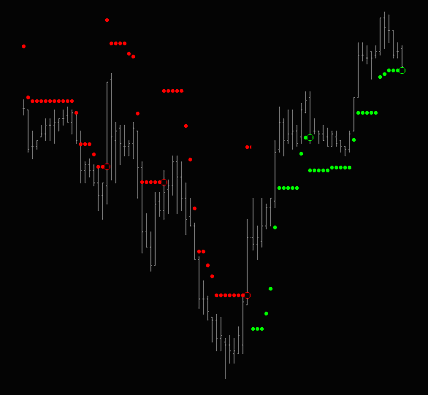 The default setting for the indicator is to plot stop-losses for both long and short positions. The long stop-loss is plotted below the price bars as a green dot, and the short stop-loss is plotted above the bars as a red dot.
In default mode, the stop-loss continues to plot regardless of whether price moves through it.
By setting ‘StepOn’ to ‘True’ in the indicator’s ‘Inputs’ tab, the stop will either remain unchanged, or move in the favour of the trade, but will only reset once it has been hit. This means that only long or short stops will be displayed at any time, dependent upon price action.
By inputting a specific price and entry time, a custom stop-loss and profit target in a user-defined ratio can be plotted (see the example of a long entry with stop and target’ below).
Long Entry with Stop and Target
On the right we examine an example of a hypothetical long position and see how various features of the Intelligent Stop and Target can be used to track the position and maximise profits.
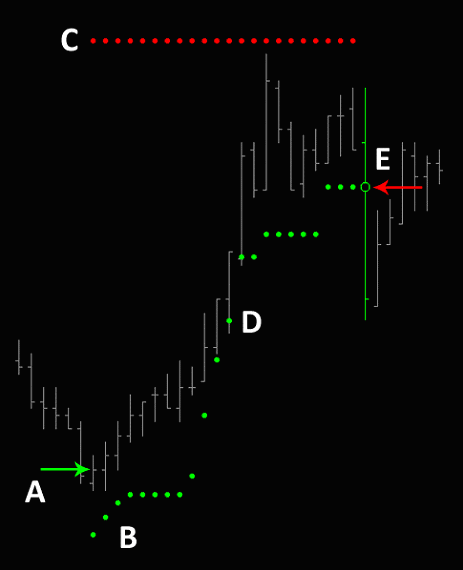 A. You decide to enter a long position, buying at 1233.25 on the close of the bar. In the ‘Format Indicator’ window you enter the entry price into the ‘LongEntryPrice’ input, and you enter 0915 as the time of the entry in the ‘Entry_Time’ input.
B. The initial stop-loss is plotted as a green dot below the entry bar. It will then begin to trail favourable price action.
C. Your strategy calls for a 9:1 ratio of reward-to-risk, so you enter ‘9’ as the ratio in the ‘Ratio’ input. A profit target is plotted as a red dot above each bar that develops. This is nine times further from your entry than your initial stop-loss is.
D. It’s important to note that you are not stopped out at point D. Your stop would only be moved up to the position of the green dot at D after that bar had closed.
E. Your profit target is almost achieved, but price then reverses and your trailing stop is elected at 1239.50. The Intelligent Stop has locked in a profit of 6.25 points.
Market Maker Strategy with the Delphic Intelligent Stop
Taking the other side of intra-day order flow can be a very lucrative tactic, especially in non-trending markets. Traditionally this was the job of the floor trader, but transferring this timeless edge from the pit to the screen can provide a consistent and methodical route to profits. A word of caution though: market making is a relentless and intense activity, not for the faint-hearted!
- On a short timeframe chart, add the Delphic Intelligent Stop indicator with the default settings to display both a long and short stop loss. Keep both a buy limit order in the market at the ‘Long Stop’, and a Sell limit order at the ‘Sell Stop’
- Stop-and-reverse, holding your position until an opposing signal is given.
- For less volatile returns, experiment with a longer term trend filter (such as the Delphic Anchor Trend) to provide a market bias, and exit rather than reverse your position on opposing signals counter to the trend filter bias.
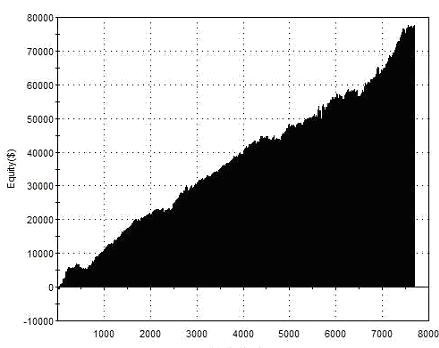
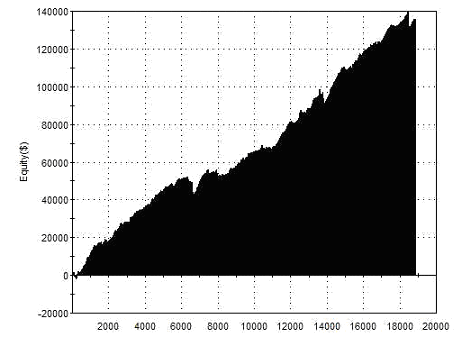
Here are the results of trading this strategy with a single E-Mini S&P futures contract over a one year period. No element of this strategy has been optimised or curve-fitted. $5 per round-trip commission has been deducted. No slippage has been deducted (not applicable to a limit order strategy). No trend or volatility filter has been applied. Reporting includes the Globex session.
 |
Total Net Profit Profit Factor Long Profit Factor Short Profit Factor Total Trades Percent Profitable Avg Trade Net Profit Maximum Drawdown |
$77,310 1.27 1.30 1.24 7693 66.98% $10.05 $5367.50 |
| Performance Report – Market Maker Strategy – @ES – 5min Bars – 07/11/2010-07/11/2011 | ||
Although the equity curve above shows returns after a generous amount of commission has been deducted (trading in the volumes above, especially across multiple markets, a trader would in fact be able to negotiate far lower commissions with their broker), and has not been optimised in any way, the fill assumption is not realistic. The Market-Maker Strategy is offered here only as a proof of concept, and work would be required to ensure that an adequate number of orders could be filled to maintain performance in live trading.
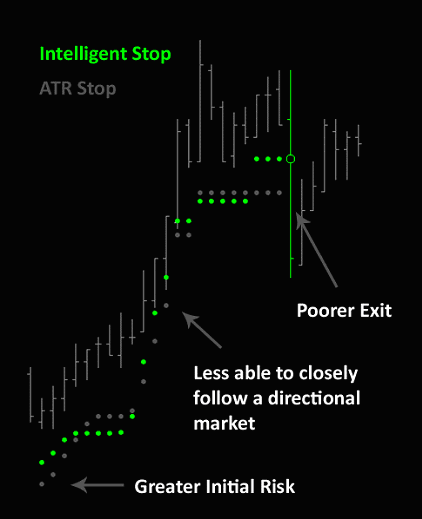
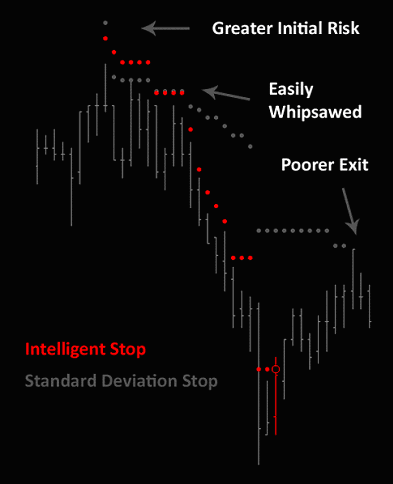
Stop-Loss Strategy Comparison
The following two charts are the same as those used in the long and short entry examples above and below. Using the same entry parameters and trailing method, an Average True Range Stop and a Standard Deviation Stop have been added to the charts.
These are common adaptive stop-loss strategies used by professional traders and money managers. Take a look at how much better the Delphic Intelligent Stop performs:
 |
 |
Pro-Trader Tips
Studies have repeatedly shown that the performance of most strategies is damaged by the inclusion of stop-losses. So why do nearly all professional traders choose to employ them? Using a stop loss is the only way to quantify your risk at the time of entry – this is essential for money management and position sizing strategies, the key components of exceptional trading.
Although the Intelligent Stop can outperform most popular stop-loss strategies, you will still need to use it with well defined risk/reward ratios tailored to the strategy you’re trading.
Pay attention if you’re stopped out on several consecutive trades – this might be a signal that the market is currently too volatile for the strategy or timeframe that you’re trading!
“Trend Following systems that use stop-loss techniques will automatically stay in the now moment as you respond just when the trend changes.” Ed Seykota
Short Entry with Stop and Target
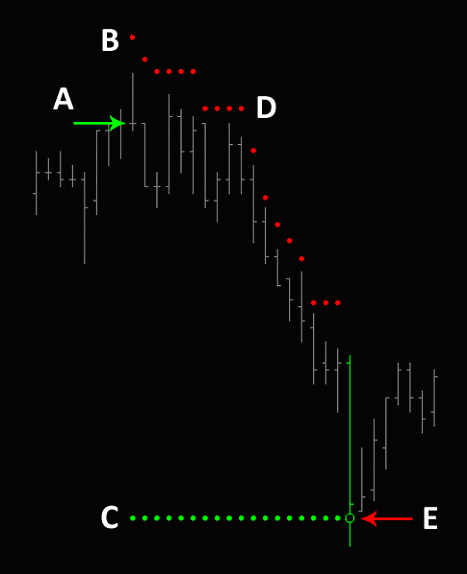 We will now take a look at an example of a how the Intelligent Stop and Target trail price, beyond market noise, during a short position. Short positions can be particularly problematic in this regard, as sell-offs in equities are typically associated with far higher volatility than stable up-trends.
A. You sell short at the close of the 1435 bar, entering the time in the ‘Entry_Time’ input and the price into the ‘ShortEntryPrice’ in the ‘Format Indicator’ window.
B. The initial stop-loss is plotted above the entry bar as a red dot. It will then begin to trail favourable price action.
C. Your strategy calls for a 6:1 ratio of reward-to-risk, so you enter ‘6’ as the ratio in the ‘Ratio’ input. A profit target is plotted as a green dot below the entry bar.
D. Notice how the stop remains beyond the reach of normal pullbacks in the trend.
E. At point E your short target is achieved.
Market Making Revisited . . .
Because the S&P500 exhibits a strong centralising tendency, they are ideally suited to an approach such as the Market Maker Strategy described above. But let’s take a look at how this strategy performs in other markets and other timeframes, including more volatile currencies and commodities. The reports below use the Delphic Intelligent Stop indicator with the default settings.
No element of this strategy has been optimised or curve-fitted. $5 per roundtrip commission has been deducted. No slippage has been deducted (slippage is not applicable to limit order only strategies), orders are assumed filled on first trade at price. No trend filter has been applied unless stated. Reporting includes the overnight Globex session.
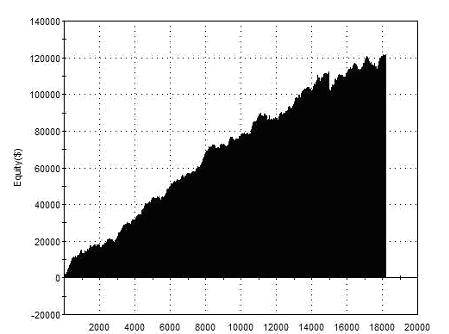
Signals from a Two Minute Chart of the Japanese Yen
 |
Total Net Profit Profit Factor Long Profit Factor Short Profit Factor Total Trades Percent Profitable Avg Trade Net Profit Maximum Drawdown |
$135,87 1.24 1.27 1.22 18,840 67.5% $7.20 $12,530 |
| Performance Report – Market Maker Strategy – @JY – 2min Bars – 11/07/2010-11/07/2011 | ||
Signals from a Daily Chart of the British Pound
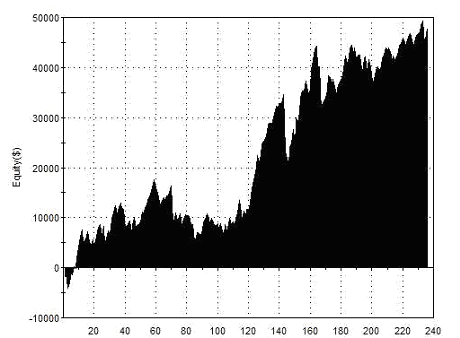 |
Total Net Profit Profit Factor Long Profit Factor Short Profit Factor Total Trades Percent Profitable Avg Trade Net Profit Maximum Drawdown |
$47,582 1.34 1.33 1.34 236 64.13% $201.62 $17,491 |
| Performance Report – Market Maker Strategy – @BP – Daily Bars – 07/11/2002-07/11/2011 | ||
Signals from a One Minute Chart of the E-Mini S&Ps with the Inclusion of the Delphic Delta Trend (Default Settings) for Signal Bias (Exit Disregards Bias).
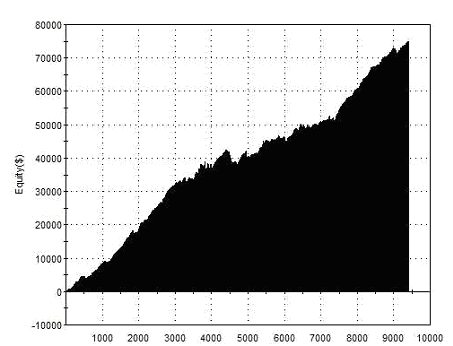 |
Total Net Profit Profit Factor Long Profit Factor Short Profit Factor Total Trades Percent Profitable Avg Trade Net Profit Maximum Drawdown |
$74,547 1.34 1.31 1.36 9,403 68.41% $7.93 $5,190 |
| Performance Report – Market Maker Strategy – @ES – One Min Bars – 07/11/2002-07/11/2011 | ||
Signals from a Two Minute Chart of the E-Mini Euro.
 |
Total Net Profit Profit Factor Long Profit Factor Short Profit Factor Total Trades Percent Profitable Avg Trade Net Profit Maximum Drawdown |
$82,282 1.13 1.14 1.12 13,706 65.46% $6.00 $11,615 |
| Performance Report – Market Maker Strategy – @EC – 2min Bars – 10/11/2010-10/11/2011 | ||
This strategy appears to produce exceptionally smooth equity curves in a variety of markets and timeframes. However, be aware that this is a high frequency strategy, and the intraday swings in equity can be far more dramatic than they appear from the disengaged perspective of a twelve month equity curve.
The average profit per trade is very small. Remember that the floor traders from whom we have borrowed this approach, typically pay virtually no exchange fees or commission and were first in line for limit order fills. If you are unable to secure the very lowest brokerage fees or get good fills on limit orders, you may well find that your overheads entirely consume an otherwise attractive net profit. On a more positive note, the high frequency at which this strategy trades should help to significantly improve the commission rate that your broker is able to offer.
Intelligent Stop & Target
|